
Open Undercurrent
How self-organization helped a small consultancy grow revenue, profitability, and engagement – all at the same time.

Let’s talk about transparency. It’s simultaneously the most powerful and most scary of the 21st-Century Org Design principles — it asks those “in power” to put a huge amount of trust in their teams, exposes issues inherent to the business to employees and maybe the world, and tugs at deep-seated desires for privacy and safety. But it also provides a critical ingredient for self-organization: casual enforcement of advantageous behaviors. Organizations usually handle “enforcement” through lots of leadership presentations, “core values”, mission statements, and aggressive review processes. It’d be better if we didn’t have to do any of that, and instead trusted each other to do the right thing.
In the last two months, we’ve become radically more transparent. We opened up Undercurrent’s books to our Members, and developed an opt-in salary transparency system in use by around 60% of the team. Today we’re going even further by opening up our key metrics to the world.
Let’s start with the top line, and work our way down!
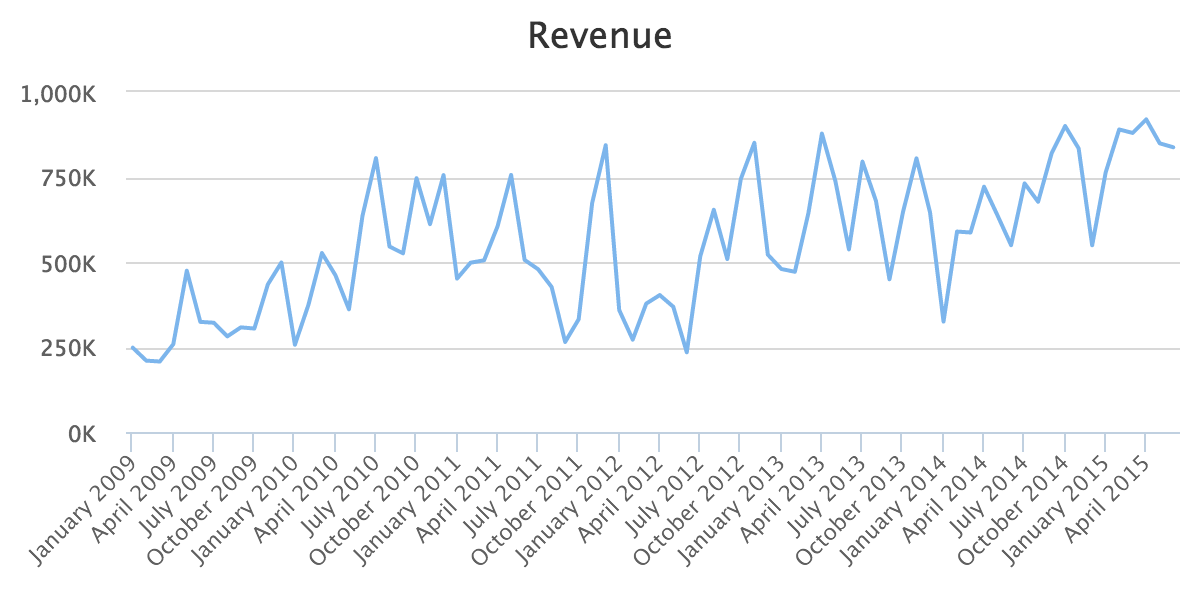
When it comes to pure revenue, Undercurrent has always been a pretty decent business. We’ve had some hiccups over the years — 2011–2012 were pretty rough times — but our last two Trimesters were particularly strong.
A note: at UC, we measure our progress in Trimesters, not Quarters. Three months isn’t enough time to get anything meaningful done as a team. And we also break up the year into four-week-long Periods, instead of using months. Months’ random duration makes them tough to use with a standardized timing and pricing scheme.
You’ll note that April was our biggest revenue month ever — we were pretty psyched about that, and amazed that we were able to get that done concurrent with the Quirky acquisition announcement.
If you want to get things done, ask a busy person, I guess.
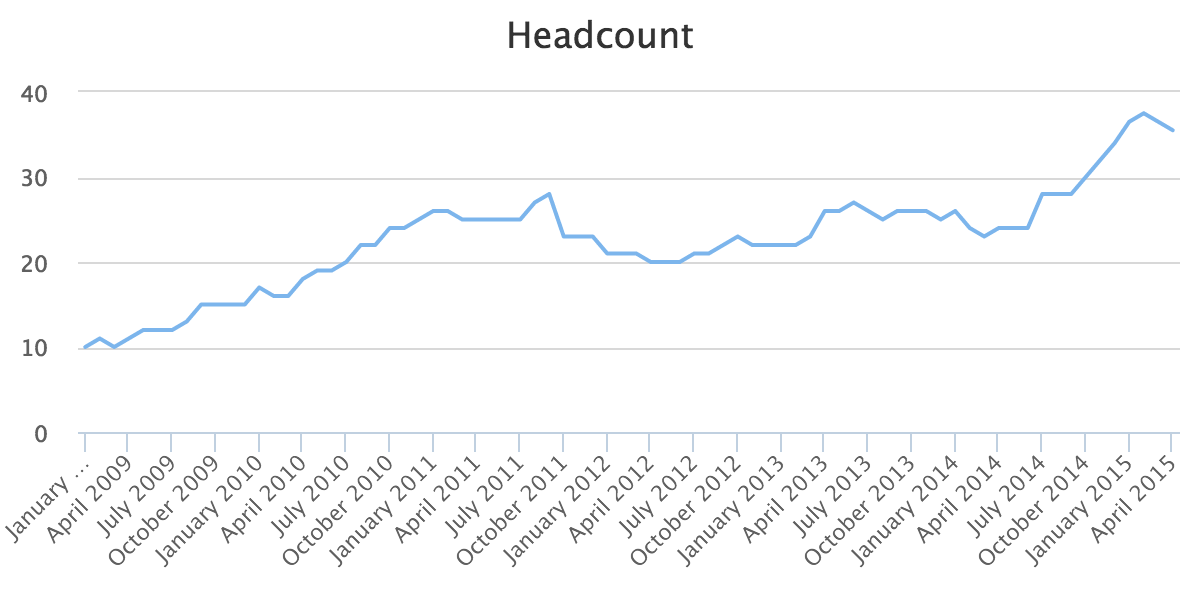
But just looking at revenue never tells the whole story. We also have to look at headcount.
The last trimester wasn’t just the biggest ever in terms of revenue, it was also the biggest in terms of population. We peaked just under 38 people (holy crap!).

With those two measures, we can get to one of our most-important metrics: revenue per head. Consulting is a people business — at least, that is, until we turn ourselves into software — and knowing how much you make per person is essential.
Also included on this chart is a rolling Trimester average, and all of these numbers are annualized, so they’re akin to looking at a run rate that shows how effective the organization is at turning people’s time into money. The halcyon days of late 2012 were interesting but unsustainable, and while we’re not posting record numbers in this category of late, we’ve unlocked a steady-state growth pattern that, at least for us, is much more appealing than maxing out revenue per head.
We’ll get to the bottom line in a moment, but for now let’s look at metrics for the team.

First cut: tenure. We’ve got a pretty new-to-Undercurrent team these days — average tenure is right around a year and a half, down from a peak of close to 3 years in the beginning of 2014. Our shift in purpose, from a strategy firm focused on hot decks to an org-design firm focused on change, certainly had something to do with this change — which you’ll see clearly in the next chart — but it’s remarkable to me that the business has generally sustained this amount of change while remaining healthy and vibrant…even with a team that’s only been together for about a year.
I attribute most of that resiliency to our ways of working and organizing. I’m convinced that while self-organization is hard, it is a valuable practice that gives groups of people a bigger lever.
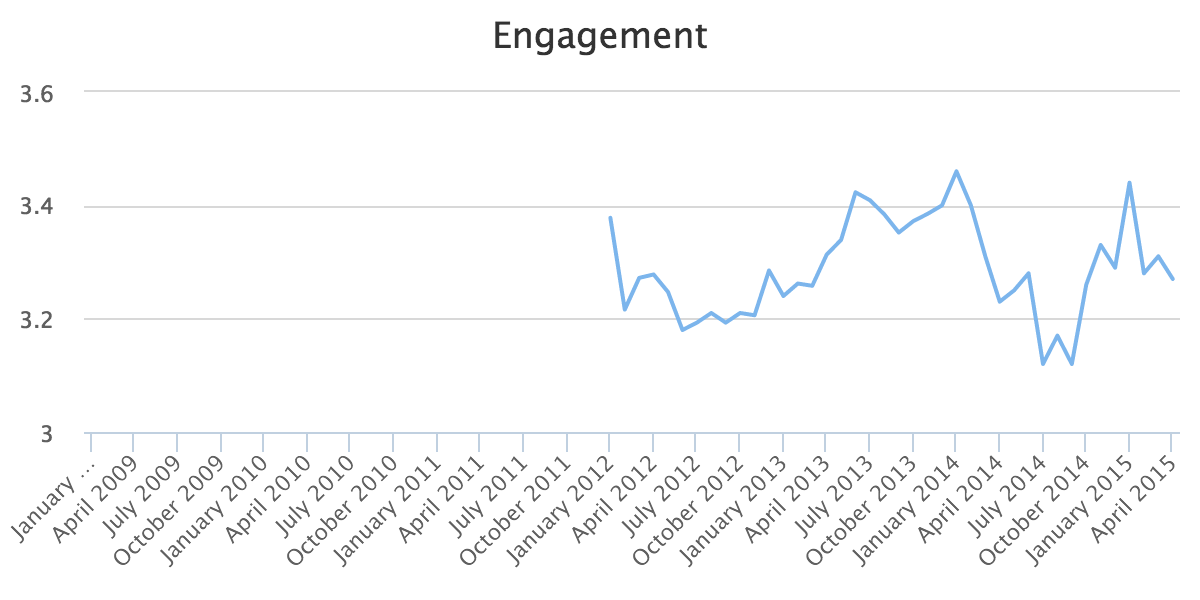
For the last 3.5 years, we’ve been tracking “Engagement” using a standardized set of questions that are a blend of thinking from Gallup and Jane McGonigal, set against a 1–4 scale (1 = strongly disagree, 4 = strongly agree):
- I know what is expected of me at work.
- I have the materials and equipment I need to do my work right.
- Work is a place where I spend time with people I like.
- My supervisor or someone at work seems to care about me as a person.
- I am constantly learning new things.
- There is someone at work who encourages my development.
- I am developing valuable expertise.
- The mission or purpose of my organization makes me feel my job is important.
- My associates or fellow employees are committed to doing quality work.
- I have a best friend at work.
- I feel like I am part of something bigger than myself.
- This last year I have had opportunities at work to learn and grow.
- At work I have the opportunity to do what I do best every day.
- In the last seven days I have received recognition or praise for doing good work.
- At work my opinions seem to count.
- In the last six months someone at work has talked to me about my progress.
Last summer was a particularly rough time at Undercurrent, where we were going through a ton of change. Some of our most-tenured folks left the company, we were struggling to get teams staffed the right way, and we added a bunch of new members all at once. And the changes to our purpose were really starting to become clear in our work. Thankfully, we bounced back, but I’m personally paying a ton of attention to this metric as we enter a new chapter at Quirky.

…Sales. We don’t track sales as religiously as we did before, predominantly because we have other metrics that have become transparent over the last couple months. Tracking sales is a lot less interesting than tracking gross and net income, especially if each team has the ability to make P&L-level decisions autonomously.
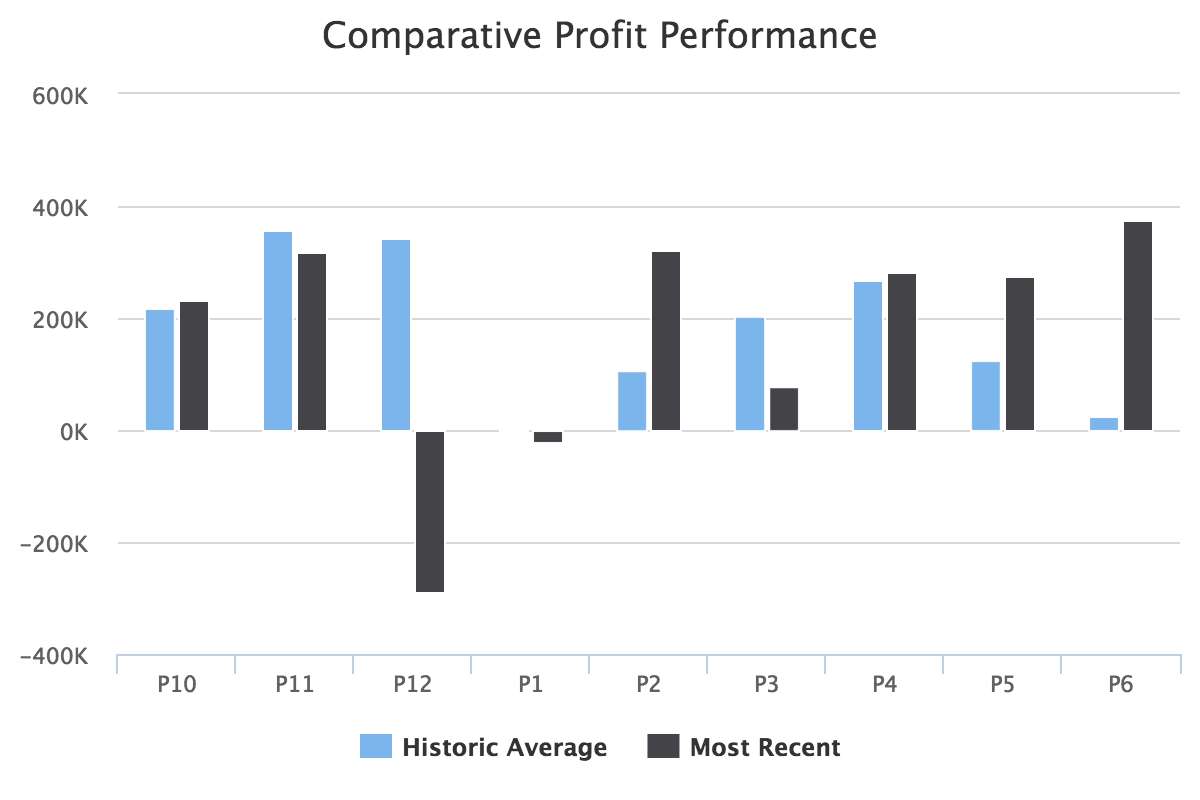
But these next charts. They’re the business.

The fun thing to do is to compare how we’re doing today, as a self-organizing company, to our more traditional past (looking at the last few years, not our early startup phase). The chart above looks at revenue from the past two trimesters, and compares our performance to our average from years’ past. Granted, the business is bigger today, so it should make more revenue. But if you squint at the chart at the top of the post, you’ll see that what’s changed about our performance isn’t that the months are way bigger than what we’d done in the past. The difference is consistency.
When most people hear “self-organizing” they think “less efficient” and “more chaotic” and “less predictable.” Those thoughts are bullshit.
Self-organization made Undercurrent more predictable. And…more efficient:
So, profit. Profit is an opinion, yes, and cash is fact. But aside from some year-end accounting stuff that I can’t talk about here, it’s also clear that self-organization has not just made us more profitable, but it’s also making us more profitable over time. Fewer centralized services are needed because each team does most of its own administration, and our new-fangled budgeting process (which is to say, we don’t budget for things, we only ask teams to report weeklywhat they’re spending) pushes teams to be more frugal. And open-book management means that we’re all thinking hard about how we’re applying our hard-earned cash to the business.
Someday I’d love to put this data on something like Baremetrics, but unfortunately our customers don’t pay us using Stripe. Fellow entrepreneurs, I’d love to see you do the same.
Comments