
On Systems & Strategy
High-quality strategies in ecosystems offer four things: loud feedback; flexibility in acceptable outcomes; shared indicators for failure and success; recognized connection points.
How might we create strategies that are built to succeed and get better over time?
Over a weird few months of “research,” diving into some pretty esoteric source material, four things came up that could/should be part of your work process and feature prominently in your deliverables:
- Clear, loud feedback & indication of system status
- Intentional flexibility for and planned reactions to failure and success within the system
- Agreed-upon indicators for the success or failure of components within the system
- A recognition and articulation of interconnectedness within the system
If you can honestly say to me that you’ve got all four of those bases covered, I’ll put money on your recommendation. If not, good luck.
Aside
For what it’s worth, I think the best strategists and thinkers do a lot of this instinctually, but precious few show their work. So what follows could possibly just be a method for making the way you understand/decide/act more explicit to those around you, be they clients, coworkers, or loved ones.
Clear Feedback & Indication of System Status
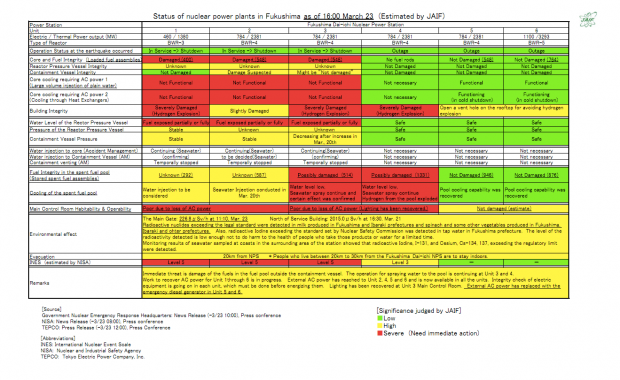
Like many geeky types, I imagine, after the Fukushima disaster I was inspired to learn more about nuclear power. That traipse through Wikipedia brought me to the above gem: a status spreadsheet for the Fukushima Dai-Ichi power plant, published here on a daily basis. The above is a map of the system a few days after the Sendai earthquake, indicating the different levels of function for key parts of the reactor facility.
For each reactor, the following parameters are listed:
- Operational Status
- Core/Fuel Integrity
- Reactor Pressure Vessel Integrity
- Core Cooling req. AC Power (injections of water into core)
- Core Cooling req. AC Power (heat exchangers)
- Building Integrity
- Water Level of the Reactor Pressure Vessel
- Pressure of the Reactor Pressure Vessel
- Containment Vessel Pressure
- Spent Fuel Integrity
- Cooling of Spent Fuel Pool
- Main Control Room Habitability & Operability
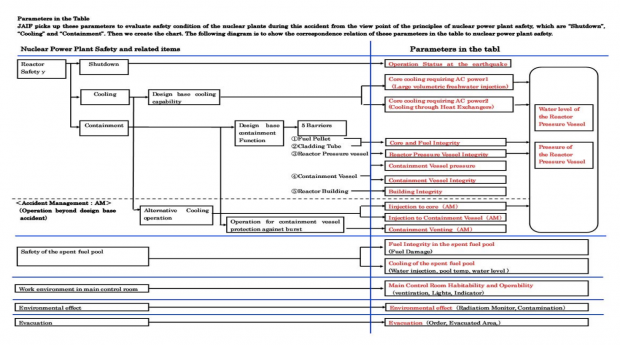
Each of these has a note and a color-code based on its significance. The reds are the ones that are severe issues and need immediate action. All of the above are essentially KPIs for nuclear reactor safety, and some are part of a cascading tree of safety relationships. Those relationships are shown in the image below (click it to enlarge). This particular situation/example isn’t really a tremendous definition of a clearly understood ecosystem of causes and effects, but it’s interesting anyway.
I’m not here to make any commentary on nuclear power, TEPCO, JAIF or any other related thing. I will say that I like the way the status is visualized here; it’s reminiscent of something my dad told me about: the “christmas tree” on a submarine.

This awesome photo (credit Telstar Logistics on Flickr) is of the christmas tree on the USS Pampanito. The lights indicate whether or not the hatches and valves on the boat are fully shut. If they’re all green, dive away. If they’re red, and you dive, you’ll sink and die a terrible death. Having hatches and valves shut is pretty important for a submersible.
Both the Fukushima table and the christmas tree indicate system status while focusing attention on critical areas. I think some sort of system qualification scheme for strategy should do the same.
The complicating factor for strategy is that many of the potential indicator lights that you could create wouldn’t be fed with clear information. It’s easy to tell if a valve or hatch is closed, and there are sensors in a reactor that can tell you about pressure levels and the like.
But what if the thing is difficult to measure? And while I’m sure that in the future everything will be measurable, in the near term some things just aren’t economical to quantitatively understand.
Agreed Indicators of Component Pass/Fail
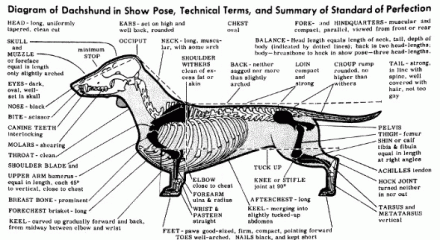
Take dog shows for example. When it comes to deciding which pups best exemplify their breed, it’s not yet feasible to implement some sort of digital system that measures whether or not a Dachshund is more balanced than a Golden Retriever. But it is feasible to agree upon what constitutes the ultimate Dachshund or Golden, write it down, and hand that out to judges and breeders. In the case of disputes, suitably detailed descriptions should help reasonable observers and participants know with confidence why one dog won and the other lost.
Seems to me you could do apply that logic to nearly every action in a system.
Switching gears only slightly to tennis.
When you’re looking for players to practice with to improve your game, it’s important to find people at or around your skill level. Too great a skill difference and it’s only fun if the better player is getting paid for their time.
But aside from having every serious/semi-serious tennis player in the world play each other and report their scores back to a governing body to establish handicapping and rating, it’s pretty difficult for two tennis players that don’t know each other to understand how they stack up. So the United States Tennis Association (USTA) created something called the National Tennis Rating Program (NTRP).
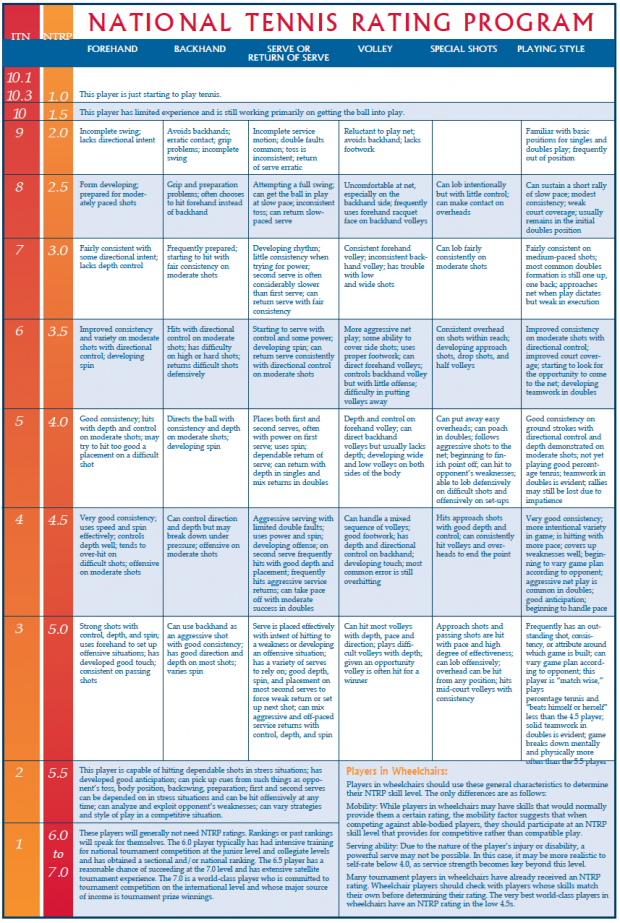
The NTRP breaks down the game into six key areas that create success. And in each category, it provides a thorough description that makes it simple to self-assess. For example:
- Forehand: Very good consistency; uses speed and spin effectively; controls depth well; tends to over-hit ondifficult shots; offensive on moderate shots
- Backhand: Can control direction and depth but may break down under pressure; offensive on moderate shots
- Serve/Return of Serve: Aggressive serving with limited double faults; uses power and spin; developing offense; on second serve frequently hits with good depth and placement; frequently hits aggressive service returns; can take pace off with moderate success in doubles
- Volley: Can handle a mixed sequence of volleys; good footwork; has depth and directional control on backhand; developing touch; most common error is still overhitting
- Special Shots: Hits approach shots with good depth and control; can consistently hit volleys and overheads to end the point
- Playing Style: Very good consistency; more intentional variety in game; is hitting with more pace; covers up weaknesses well; beginning to vary game plan according to opponent; aggressive net play is common in doubles; good anticipation; beginning to handle pace
Performing up to those descriptions gets you a 4.5 rating. Interestingly, at the upper end of the table – 5.5 to 7.0 – they get more holistic, and indicate that the player probably doesn’t need a rating, as they’ll be playing competitively and their ranking will be more easily judged by their success against peers.
So it’s possible to blend multiple qualification methods into one system.
Ultimately, when it’s difficult or expensive to connect data to a success/fail judgment, know that there is another way: clearly defining success characteristics, and allowing for self- or peer-evaluation against those characteristics.

Flexibility for and Planned Reactions to System Fail/Win
Last Christmas, my wonderful parents gave me my grandma’s KitchenAid stand mixer. It’s a gorgeous, reliable machine, but was a little dirty. As I researched the process for cleaning the mixer, I found the above image, depicting (among other things) something called a “Fail-Safe Gear”. It’s the grey gear in the lower-right, and it’s made out of plastic. It’s designed to strip out if the contents of the mixing bowl get stuck, preventing the motor from overheating.
Genius.
It seems crazy at first to introduce a part that is designed to fail into a system, but when the components upstream of that part are expensive, hard-to-maintain or hard-to-replace, it makes a ton of sense. And while this is an engineering solution, to be sure, it’s a clear example of an established reaction to a common failure that prevents damage to the majority of the system’s components.
Another example of this (again from tennis) is the way ball marks on clay courts allow for clear challenge-resolution. No need for Hawk-Eye replays to determine whether a ball was in or out. Just check the mark.
But perhaps the most interesting example of this that I’ve found is the system of flight laws that exist in modern fly-by-wire aircraft (Airbus A320-on and Boeing 777-on). In older, simpler planes, control surfaces, engines and other important systems are controlled mechanically. In more advanced planes, pilot control inputs are fed through a set of computers that relay potentially modified commands to the engines and control surfaces, actively preventing bad shit from happening. When everything is operational, the pilot can’t accidentally or purposefully induce a stall, over-speed, or excessively roll the plane. Which is totes a good thing.
Warning: bad things happen to good systems.
Here’s how.
While all the systems in these modern planes are impressively redundant, a set of well-defined Flight Control Laws exist to cede control of the plane directly to the pilots as systems break down. Unfortunately, though, many pilots either aren’t prepared for managing this cession of control or aren’t well informed when the system breaks down.
Great example: AF447.
After diving into the murky waters surrounding the Air France flight 447 crash, I discovered this page outlining the parameters of all the laws programmed into Airbus’ flight control systems. In the case of AF447, almost all the systems had broke down, putting the plane into “Direct Law” where the pilots were in complete physical control of the aircraft. Where the plane would normally be protected from excessive Angle of Attack (AOA), excessive speed and lost lift, all of which seem to have contributed to the crash of the AF447 crash.
Unfortunately, though, the systems did break down: the speed-sensing-by-way-of-pressure-differential pitot tubes iced over, and without that crucial data point, the Airbus A330 began to — for lack of a better term — shut down, leaving the pilots completely in control of an airplane going too fast for conditions and rapidly approaching a stall.
It’s still a mystery what exactly happened in the cockpit, but the flight data recorders indicate that the pilots didn’t quite know what to do. It was the middle of the night, they were flying through storms that impacted their sense of direction, and they were receiving conflicting information about their attitude. The plane’s systems shut down to give them complete flexibility to return to a salvageable course, but the pilots either didn’t have the experience or the information necessary to do so.
The two principal complaints on the aviation boards are pretty cutting:
- A simple, and cheap GPS system would have been a serviceable backup system for the onboard computers
- More stick-in-hand manual flying time for long-haul pilots (apparently the guys at the helm had a total of 13 hours of unaided flight time in the A330/340 platform) is a necessary precaution for an automated system where the backup plan is to hand over control to the pilots
One cheap solution and one expensive solution, both of which I’m sure were considered and left out. Sad.
Several of the examples I’ve used here are from safety-first industries where systems thinking is an absolute necessity. The specifics of the Fukushima and AF447 scenarios are excellent examples of situations where the real-life conditions exceeded the maximum tolerances that the system was designed to accommodate. But it’s important to remember that the systems work pretty darn well most of the time; for their huge inherent risk, both nuclear power generation and large-scale commercial travel are exceptionally safe.
So how do we apply these lessons to the business of creating strategy where the intent is to sell more stuff?
Recognition and Articulation of Interconnectedness
The last, and perhaps most important step in creating a system that isn’t prone to breakage is to understand and describe how the component parts affect and are affected by each other. This has the fantastic potential upside of helping create a system that gets better under stress rather than worse.
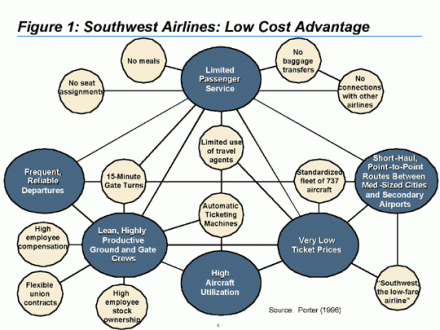
One of the best examples of a clearly articulated system map came to me from the previously mentioned UC alumnus. It’s the Ryanair business plan, expressed as a network of interconnected nodes. Each node on the map is a critical part of their business – some important decision they made about how they were going to operate – and where appropriate the nodes are connected with directional, annotated arrows describing the affects certain decisions have on other decisions.
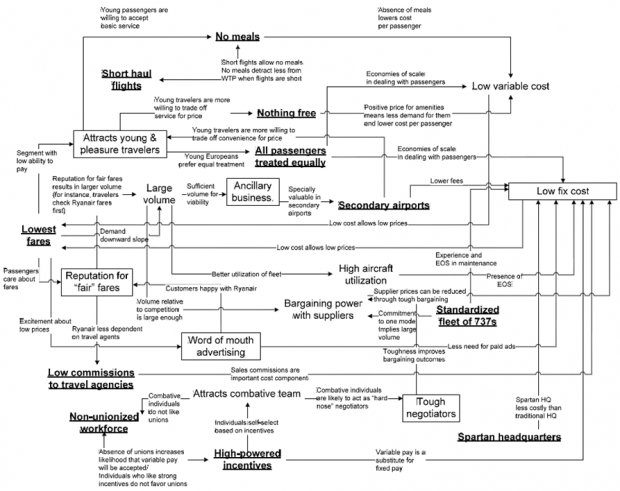
Funny thing: I’ve never seen this employed by anyone with the word strategist in their title. Nor have I seen it on the cube walls of the many offices I visit. Nor has it been provided in source material on the projects I’ve done. All this in the face of the fact that it’s a central part of the way that some dude called Porter understands strategy.
My assumption is that this doesn’t get done for two reasons:
- Talking about interconnectedness and pass/fail conditions runs contrary to the way that most businesses operate, no matter their scale. Most places – especially marketing organizations – just don’t do feedback well.
- It’s complex. Complexity is just plain difficult to deal with, difficult to understand, difficult to plan around. Doing all these things well would require a strong command of data, strong internal commitment to shared goals, and a belief in organizational adaptability. Name an organization that has all of those things throughout its ranks.
Predictably, most of the examples of effective interconnectedness of disparate systems/nodes are found in nature. And to my knowledge, we’ve had a pretty piss-poor track record of replicating the natural, successful complexity.
So, what next?
So: implement these methods. Parse the systems you create into specific nodes, and explain how they interact. Write down and agree to qualification schemes that allow you to understand when hard-to-measure things are successful or not. Build in failsafes that allow you to survive failure.
But most of all, make it clear, make it simple, make it explicit.
Comments